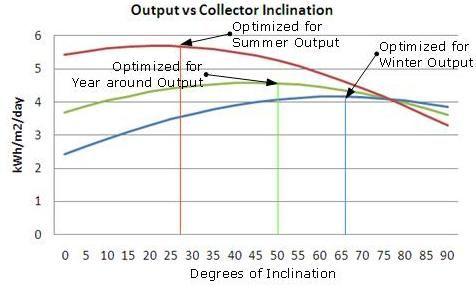
The graph below shows how the average daily output can be made to vary by focusing on the season that the heat is targeted at. The green curve is the average daily output focused at year around results. As you can see the peak occurs at an inclination of around 50°, which is indeed the latitude at Winnipeg Canada. This inclination would be a good one for a year-round solar hot water application, such as a car wash, or domestic hot water heating. The blue graph only uses data from October 1 to April 30 a period of 7 month. This, for Winnipeg, would be the home heating season. The peak occurs at approx. 66 degrees. This would be a good inclination for a heating application such as radiant in-floor heating. The red graph only uses data from May 1 to September 30th a period of 5 month. The peak in this case occurs at about 27 degrees (. This would be the angle the collectors should be set at if the main purpose was for maximizing a summer Solar Pool Heating System.
Also note that for the winter heating situation (blue graph), the results remain good at the high angles. Decent results are obtained over the entire range of 50-90°. Similar for the summer heating situation (red graph) the results remain good at the low angles. Decent results are obtained from 0° to about 35°. For the year around situation good results are obtained in the mid range of 35° to 65°. The above graphs were produced using a simulation program, RETScreen that uses actual meteorological and NASA data for Winnipeg, rather than just theoretical sun radiation data.