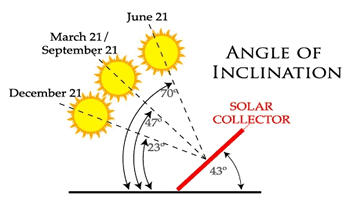
Next you need to determine the angle of inclination you are going to utilize. This is the tilt angle whereby vertical is 90 degrees and horizontal is 0 degrees. This inclination angle will play a role in determining the performance during the seasons. If you use a steep angle, you will have better relative performance during the winter when the sun is at a lower angle. This is a great strategy for application that requires maximum collection performance in the winter. However, if you are looking for the best annual average performance, then the rule of thumb is to tilt the collectors at an angle equal to the geographical latitude. If you are looking for only summer performance such as for a seasonal pool, then a flatter angle is better.
Calculating the Angle of a Solar Collector
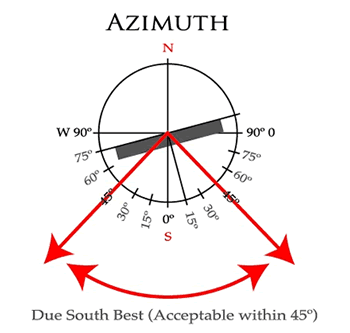
The 1st task is finding the best location for your collectors. This means finding an unobstructed view to the south. A perfect view is not mandatory, and the solar system will still work fine, but the better the south view the greater the performance. The ideal location is due south however the azimuth (degrees off of south), can be as great as 45 degrees East or West and still provide reasonable performance.
TIP: When checking your view, remember that the sun is always higher in the sky in the summer. A neighboring building may look like the sun clears it but you may find that it is actually shading your location in the winter. Also, remember that trees with leaves will shed their foliage in the fall and provide more sun in the winter which can be a great strategy for reducing summer heating and increasing winter heating for solar space heating system. But not great for solar pool heating in the summer.
Example Location Winnipeg, MB – latitude = 50 degrees.
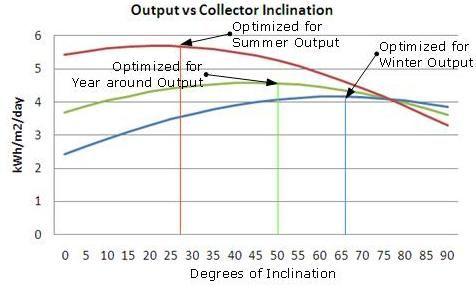
The graph below shows how the average daily output can be made to vary by focusing on the season that the heat is targeted at. The green curve is the average daily output focused at year around results. As you can see the peak occurs at an inclination of around 50°, which is indeed the latitude at Winnipeg Canada. This inclination would be a good one for a year-round solar hot water application, such as a car wash, or domestic hot water heating. The blue graph only uses data from October 1 to April 30 a period of 7 month. This, for Winnipeg, would be the home heating season. The peak occurs at approx. 66 degrees. This would be a good inclination for a heating application such as radiant in-floor heating. The red graph only uses data from May 1 to September 30th a period of 5 month. The peak in this case occurs at about 27 degrees (. This would be the angle the collectors should be set at if the main purpose was for maximizing a summer Solar Pool Heating System.
Also note that for the winter heating situation (blue graph), the results remain good at the high angles. Decent results are obtained over the entire range of 50-90°. Similar for the summer heating situation (red graph) the results remain good at the low angles. Decent results are obtained from 0° to about 35°. For the year around situation good results are obtained in the mid range of 35° to 65°. The above graphs were produced using a simulation program, RETScreen that uses actual meteorological and NASA data for Winnipeg, rather than just theoretical sun radiation data.